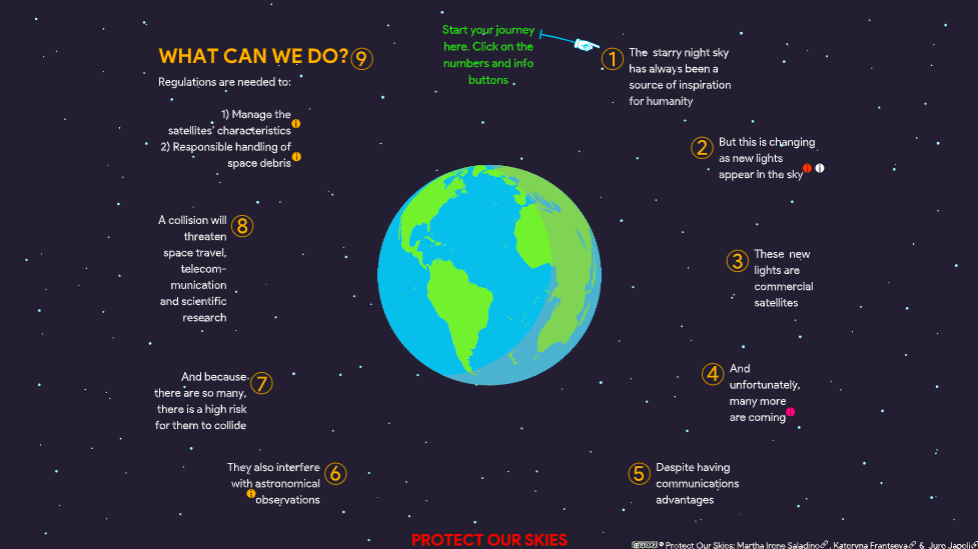
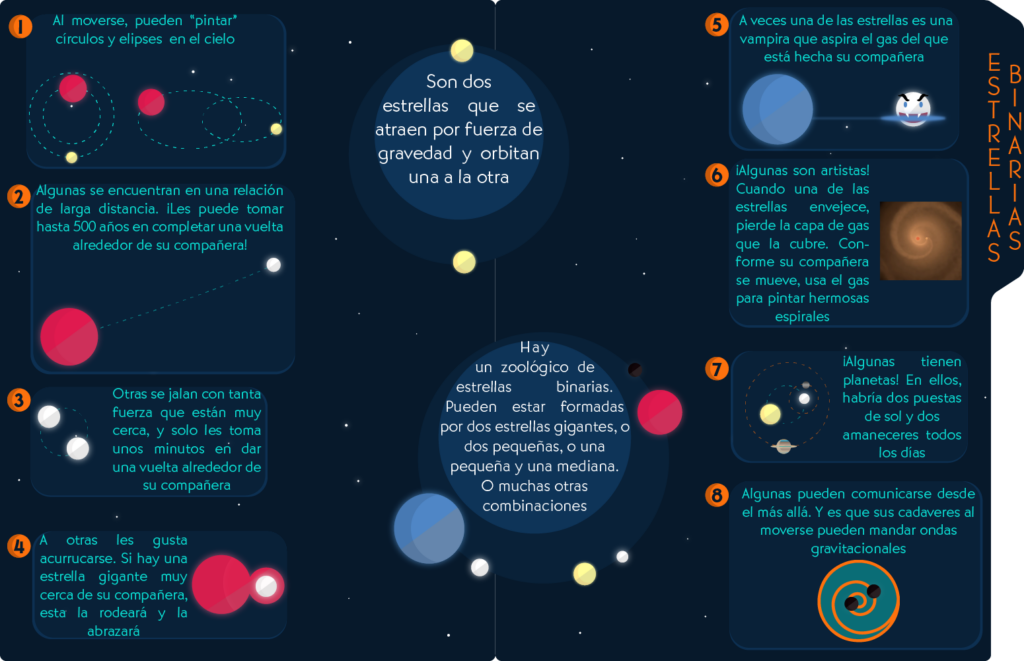
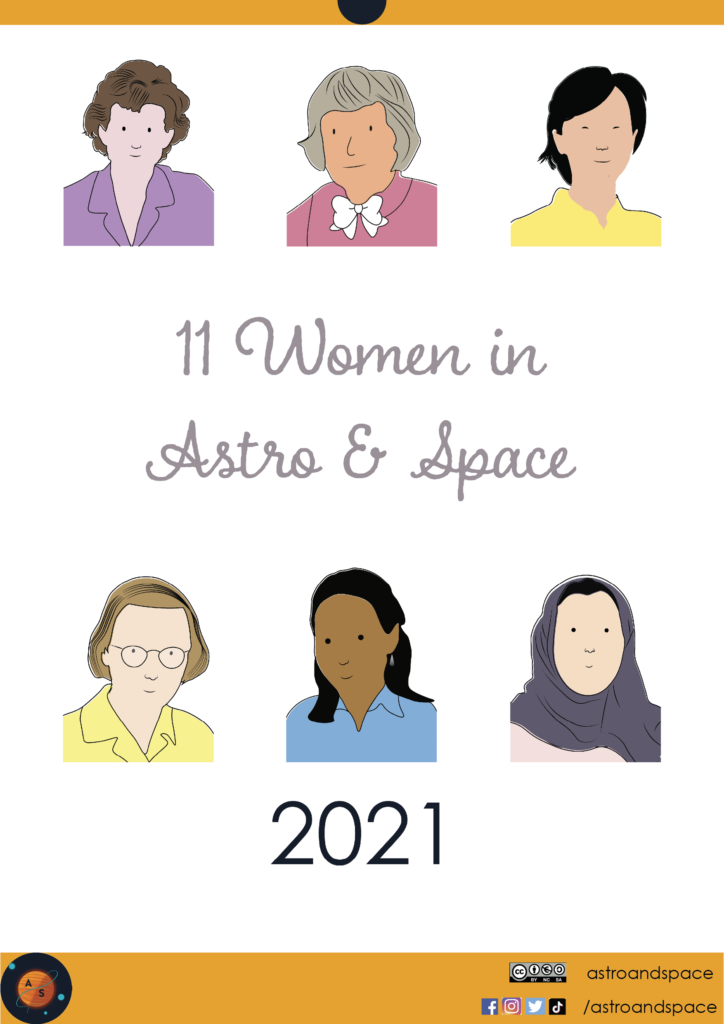
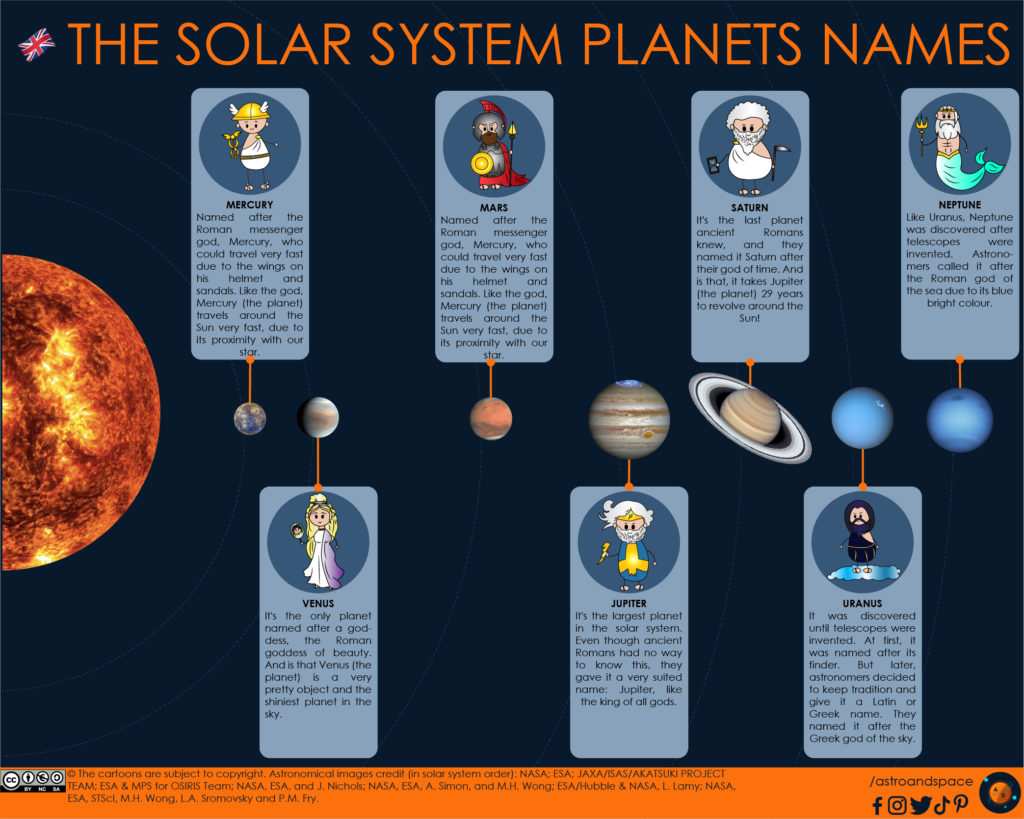
Here you can find some of the infographics that I have designed (including those not meant for astronomy). Click on them to enlarge them.

This is my first interactive infographics. Click on the image to go to the interactive one.
This is by far my favourite infographics. Not only because it shows the research I used to do, but also because it’s quite simple yet a bit artistic. It’s only in Spanish as I did it for a workshop I was invited to do by SciArt LATAM.
The diversity of women in astronomy, astrophysics and space sciences
Not really an infographics, but a calendar. Click on the image to download it.
Cute infographic to explain the name of the planets in the Solar system
Infographic for Halloween about astronomical objects
Infographic of the scientific article entitled: “An outflow powers the optical rise of the nearby, fast-evolving tidal disruption event AT2019qiz” by Dr Matt Nicholl+ on MNRAS.

Infographics for @astroandspace about stellar winds
Astroinfographics part of the series What do astronomers do all day? for @astroandspace. It’s also available in English
Astroinfographics part of the series What do astronomers do all day? for @astroandspace. It’s also available in English.
Astroinfographics part of the series What do astronomers do all day? for @astroandspace. It’s also available in Spanish.
I was commissioned to make this infographic (illustrations and design). It’s protected by a watermark.
Astroinfographics part of the series What do astronomers do all day? for @astroandspace. It’s also available in Spanish.
Astroinfographics for @astroandspaceTypes of astronomers“. It’s also available in Spanish.
Infographic of the scientific article entitled: “Gargantuan chaotic gravitational three-body systems and their irreversibility to the Planck length” by Dr Tjarda Boekholt et al. on MNRAS.

Map of the touristic locations in the State of Mexico, Mexico.