Protect Our Skies
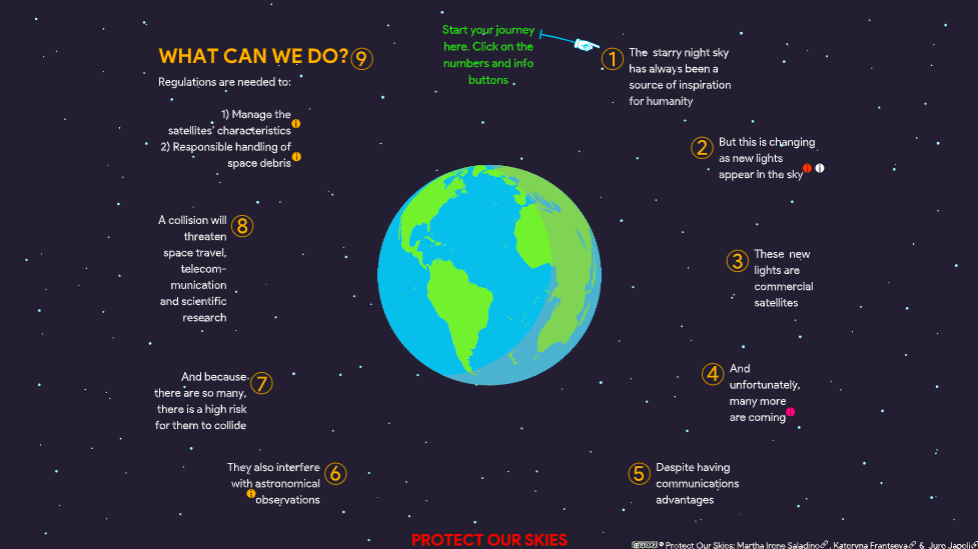
This is an interactive infographic I made as part of the campaign called “Protect Our Skies”, whose aim was to create awareness of the implications of satellite pollution on astronomy. To access the interactive version click here or on the image.
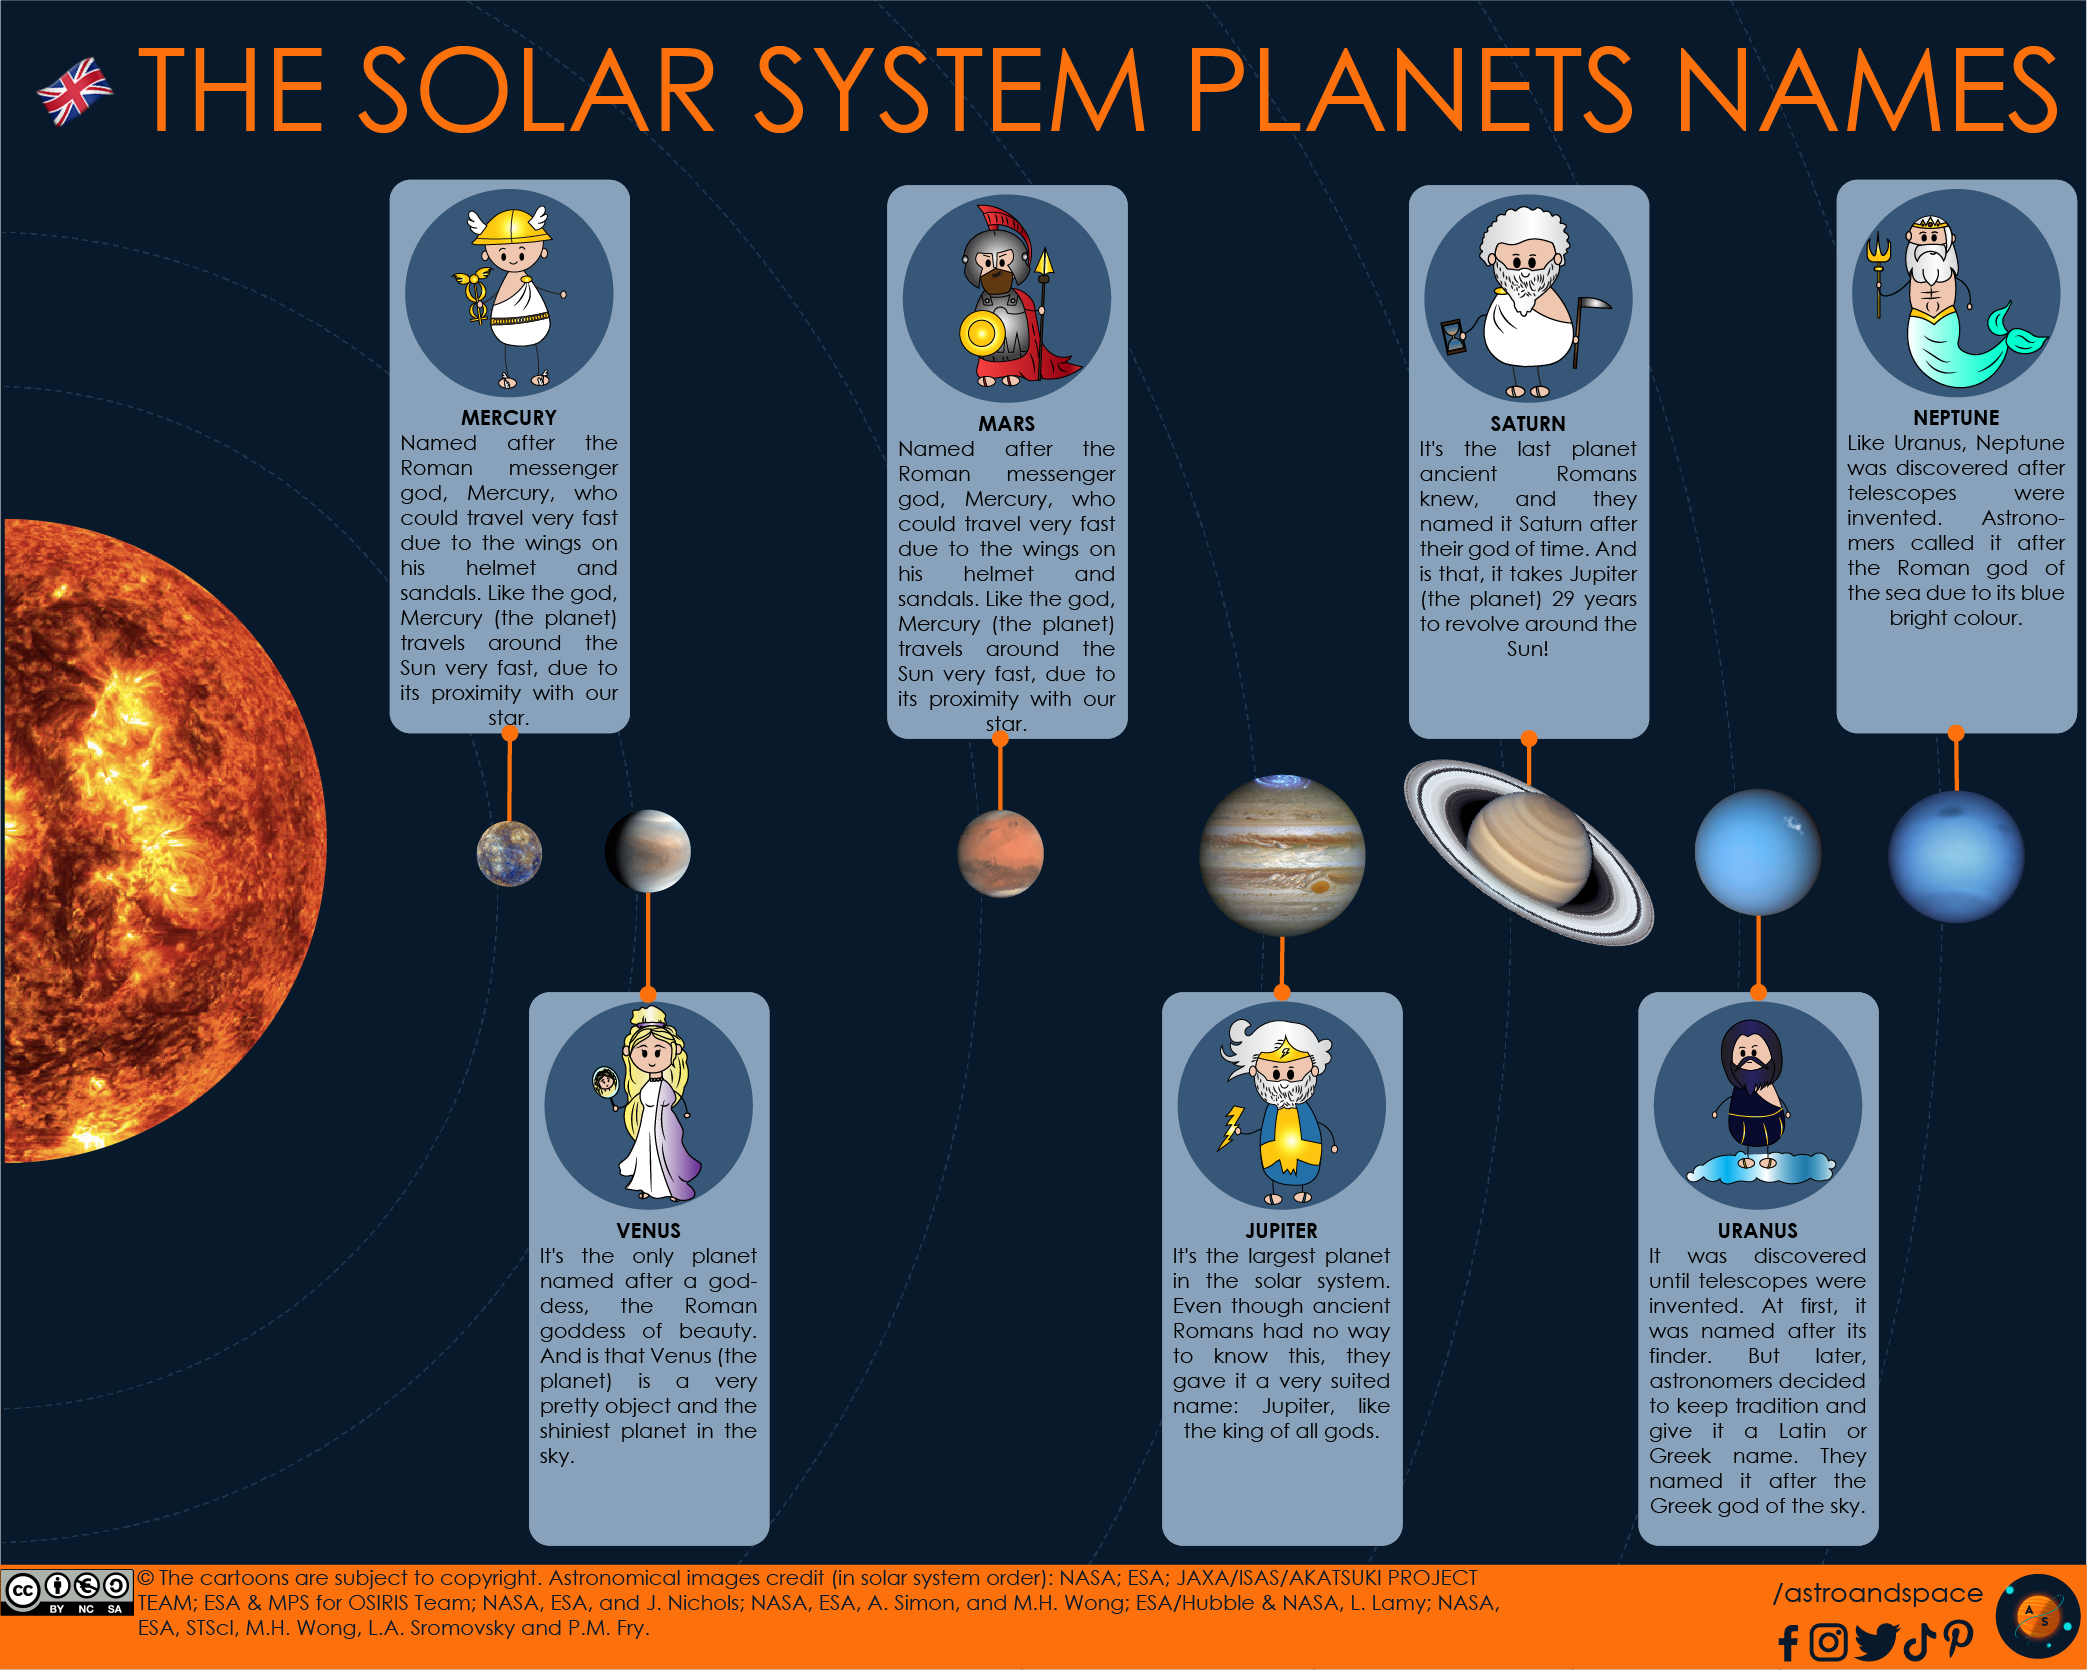
The Solar System Planets Names
February 11th
This is not really an infographic but a calendar I made to celebrate the International Day of Women and Girls in Science. I hope you enjoy it. Click on the image to go to the PDF.
#Astrospooky
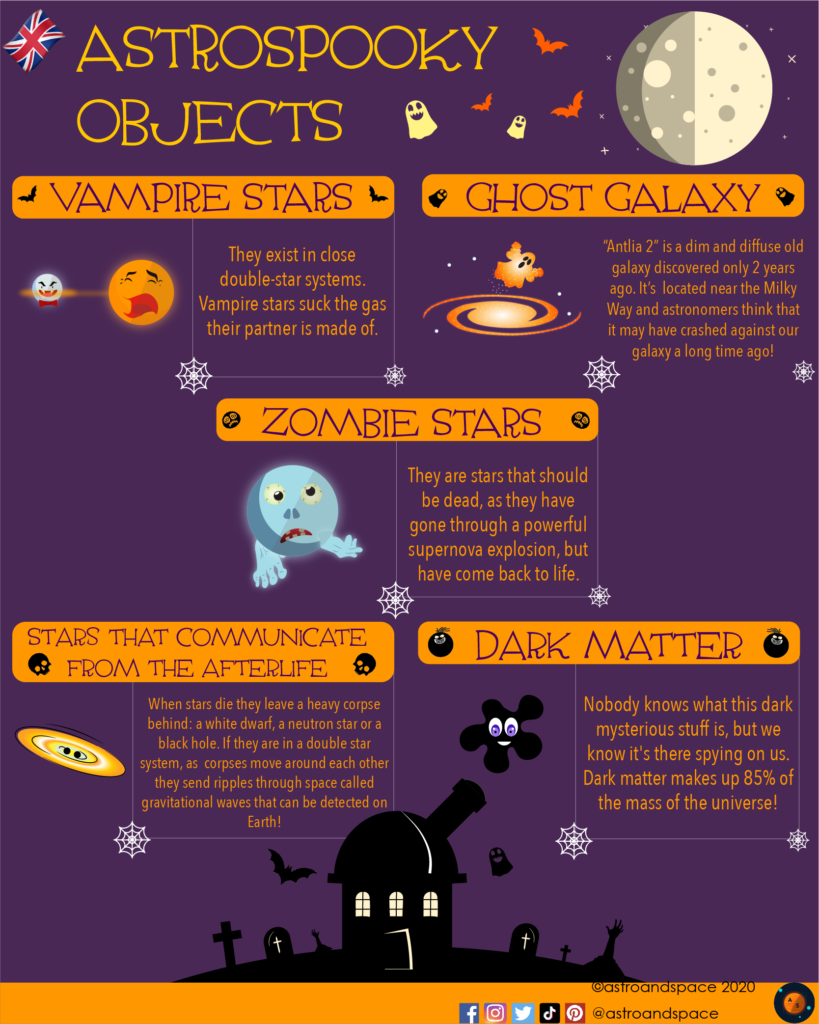
I designed this infographic for social media for Halloween 2020
#Astroinfographics
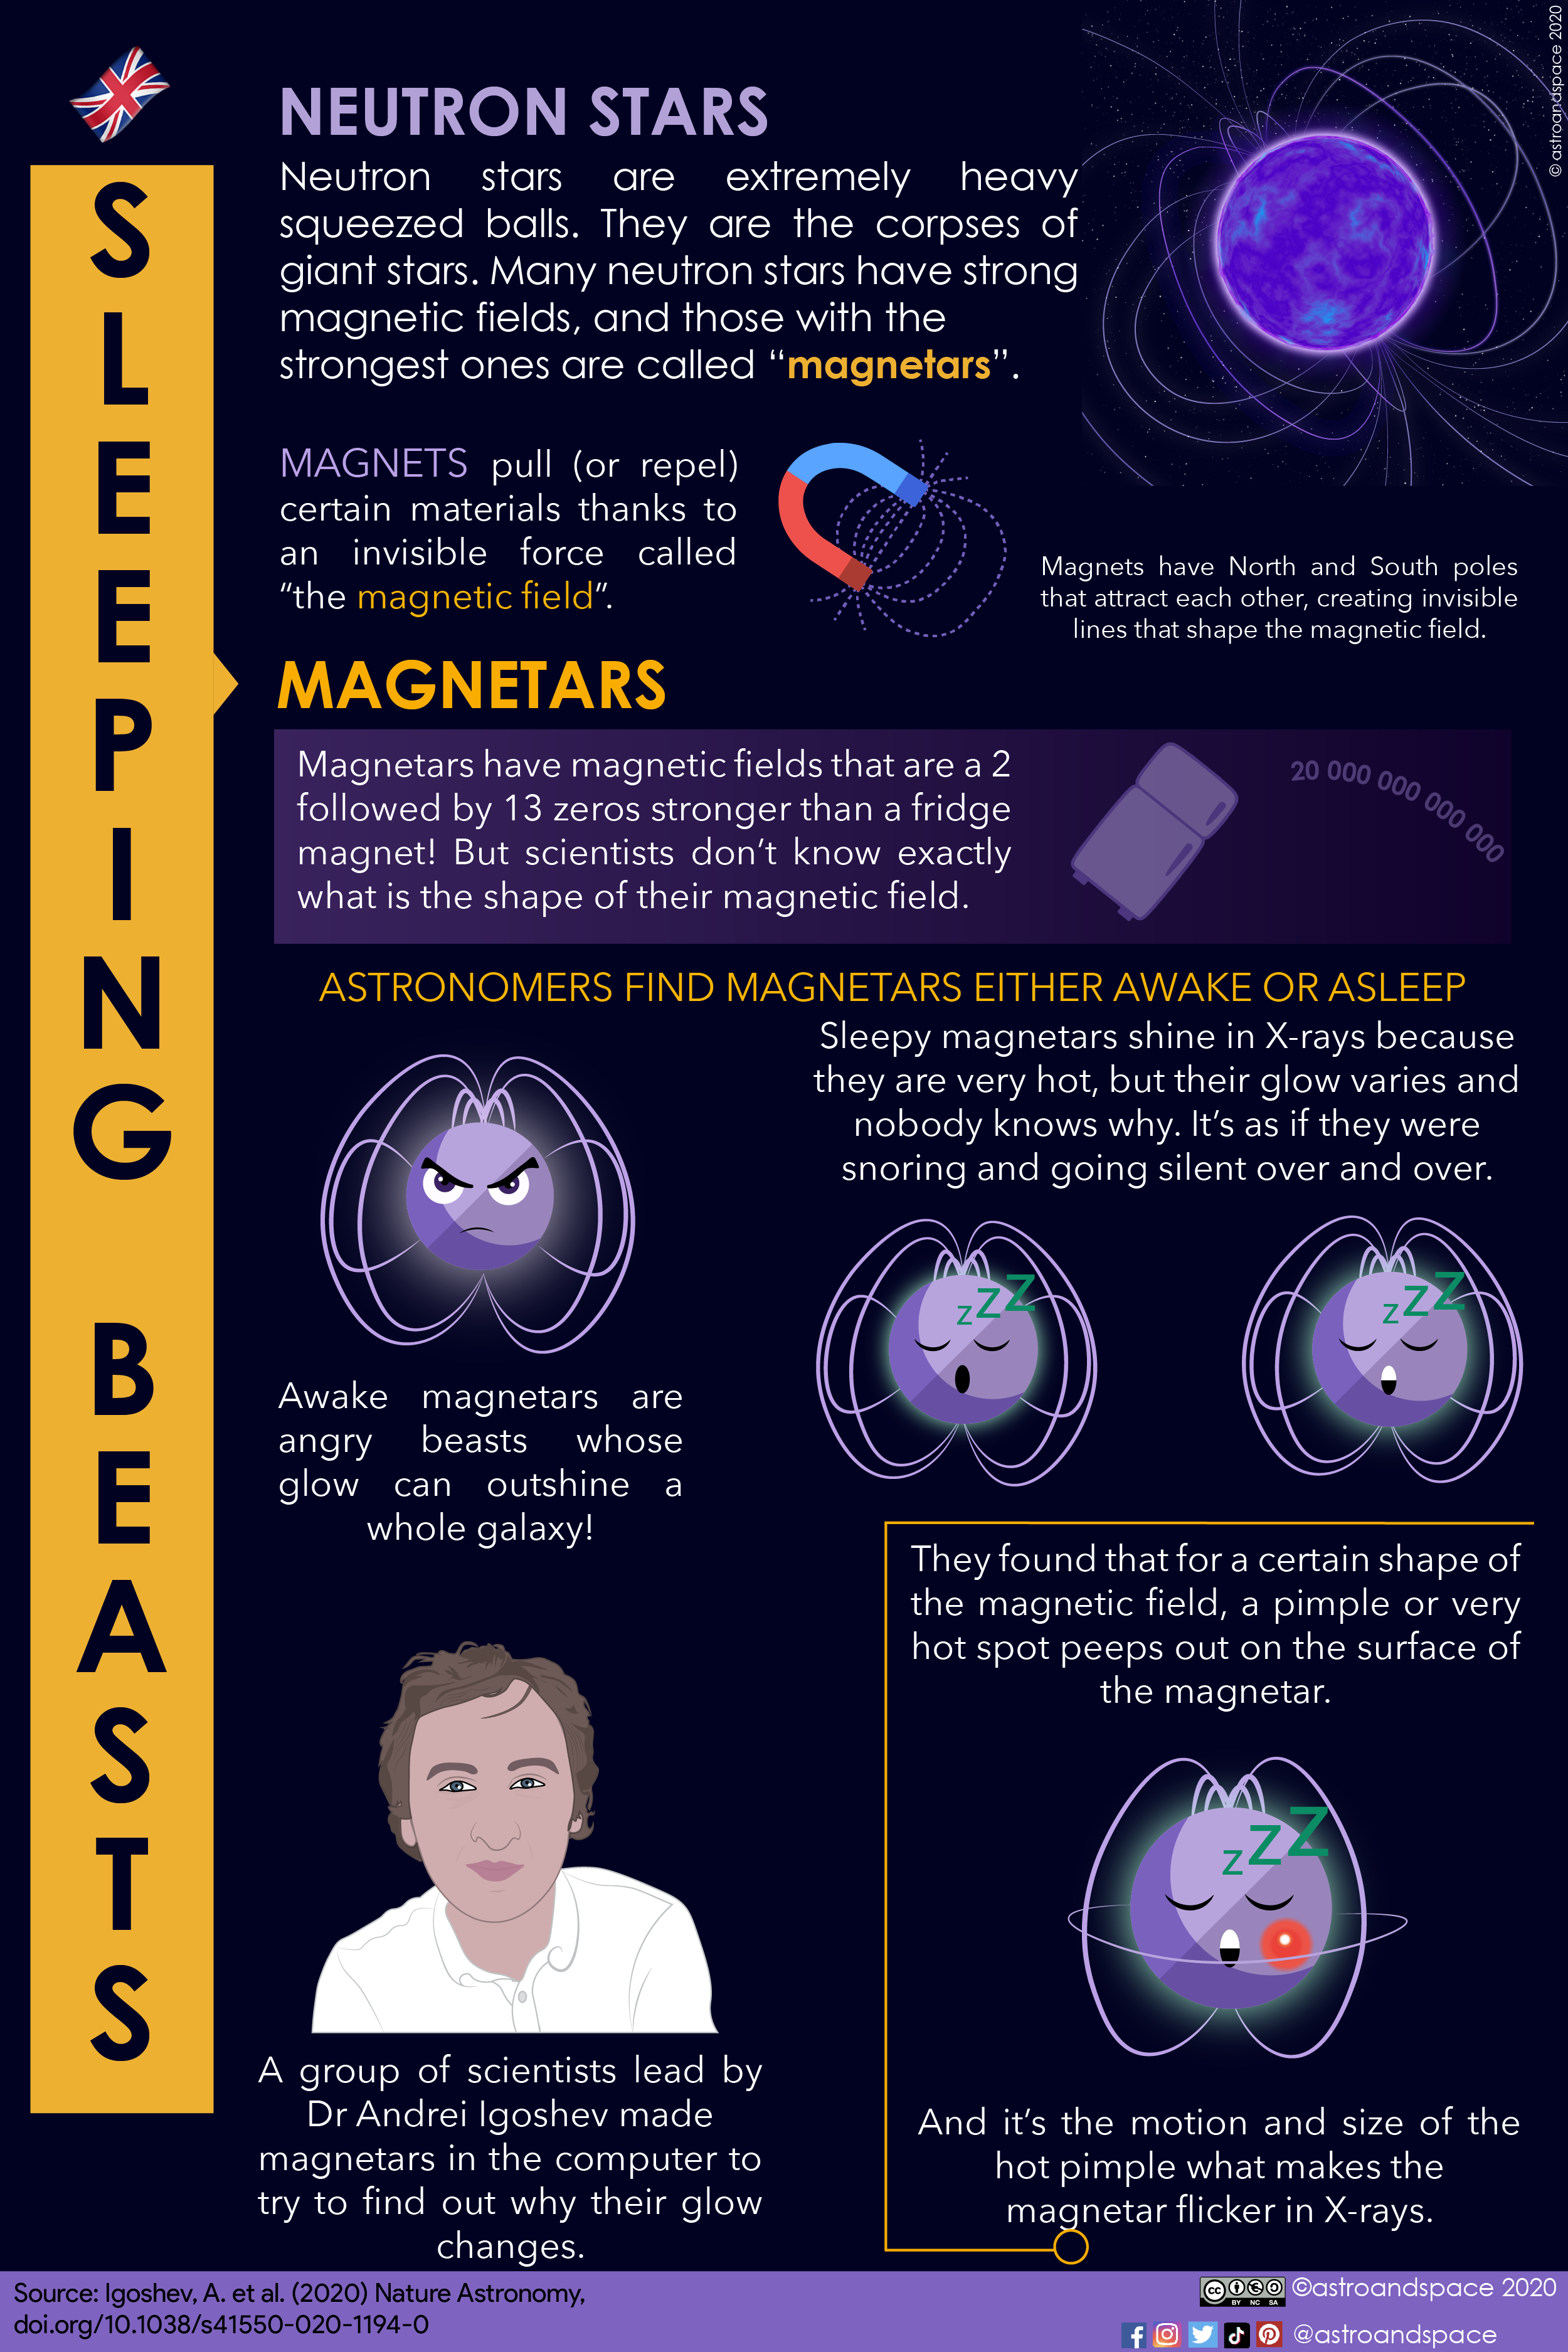
Infographics of Dr Andrei Igoshev‘s article: “Strong toroidal magnetic fields required by quiescent X-ray emission of magnetars“
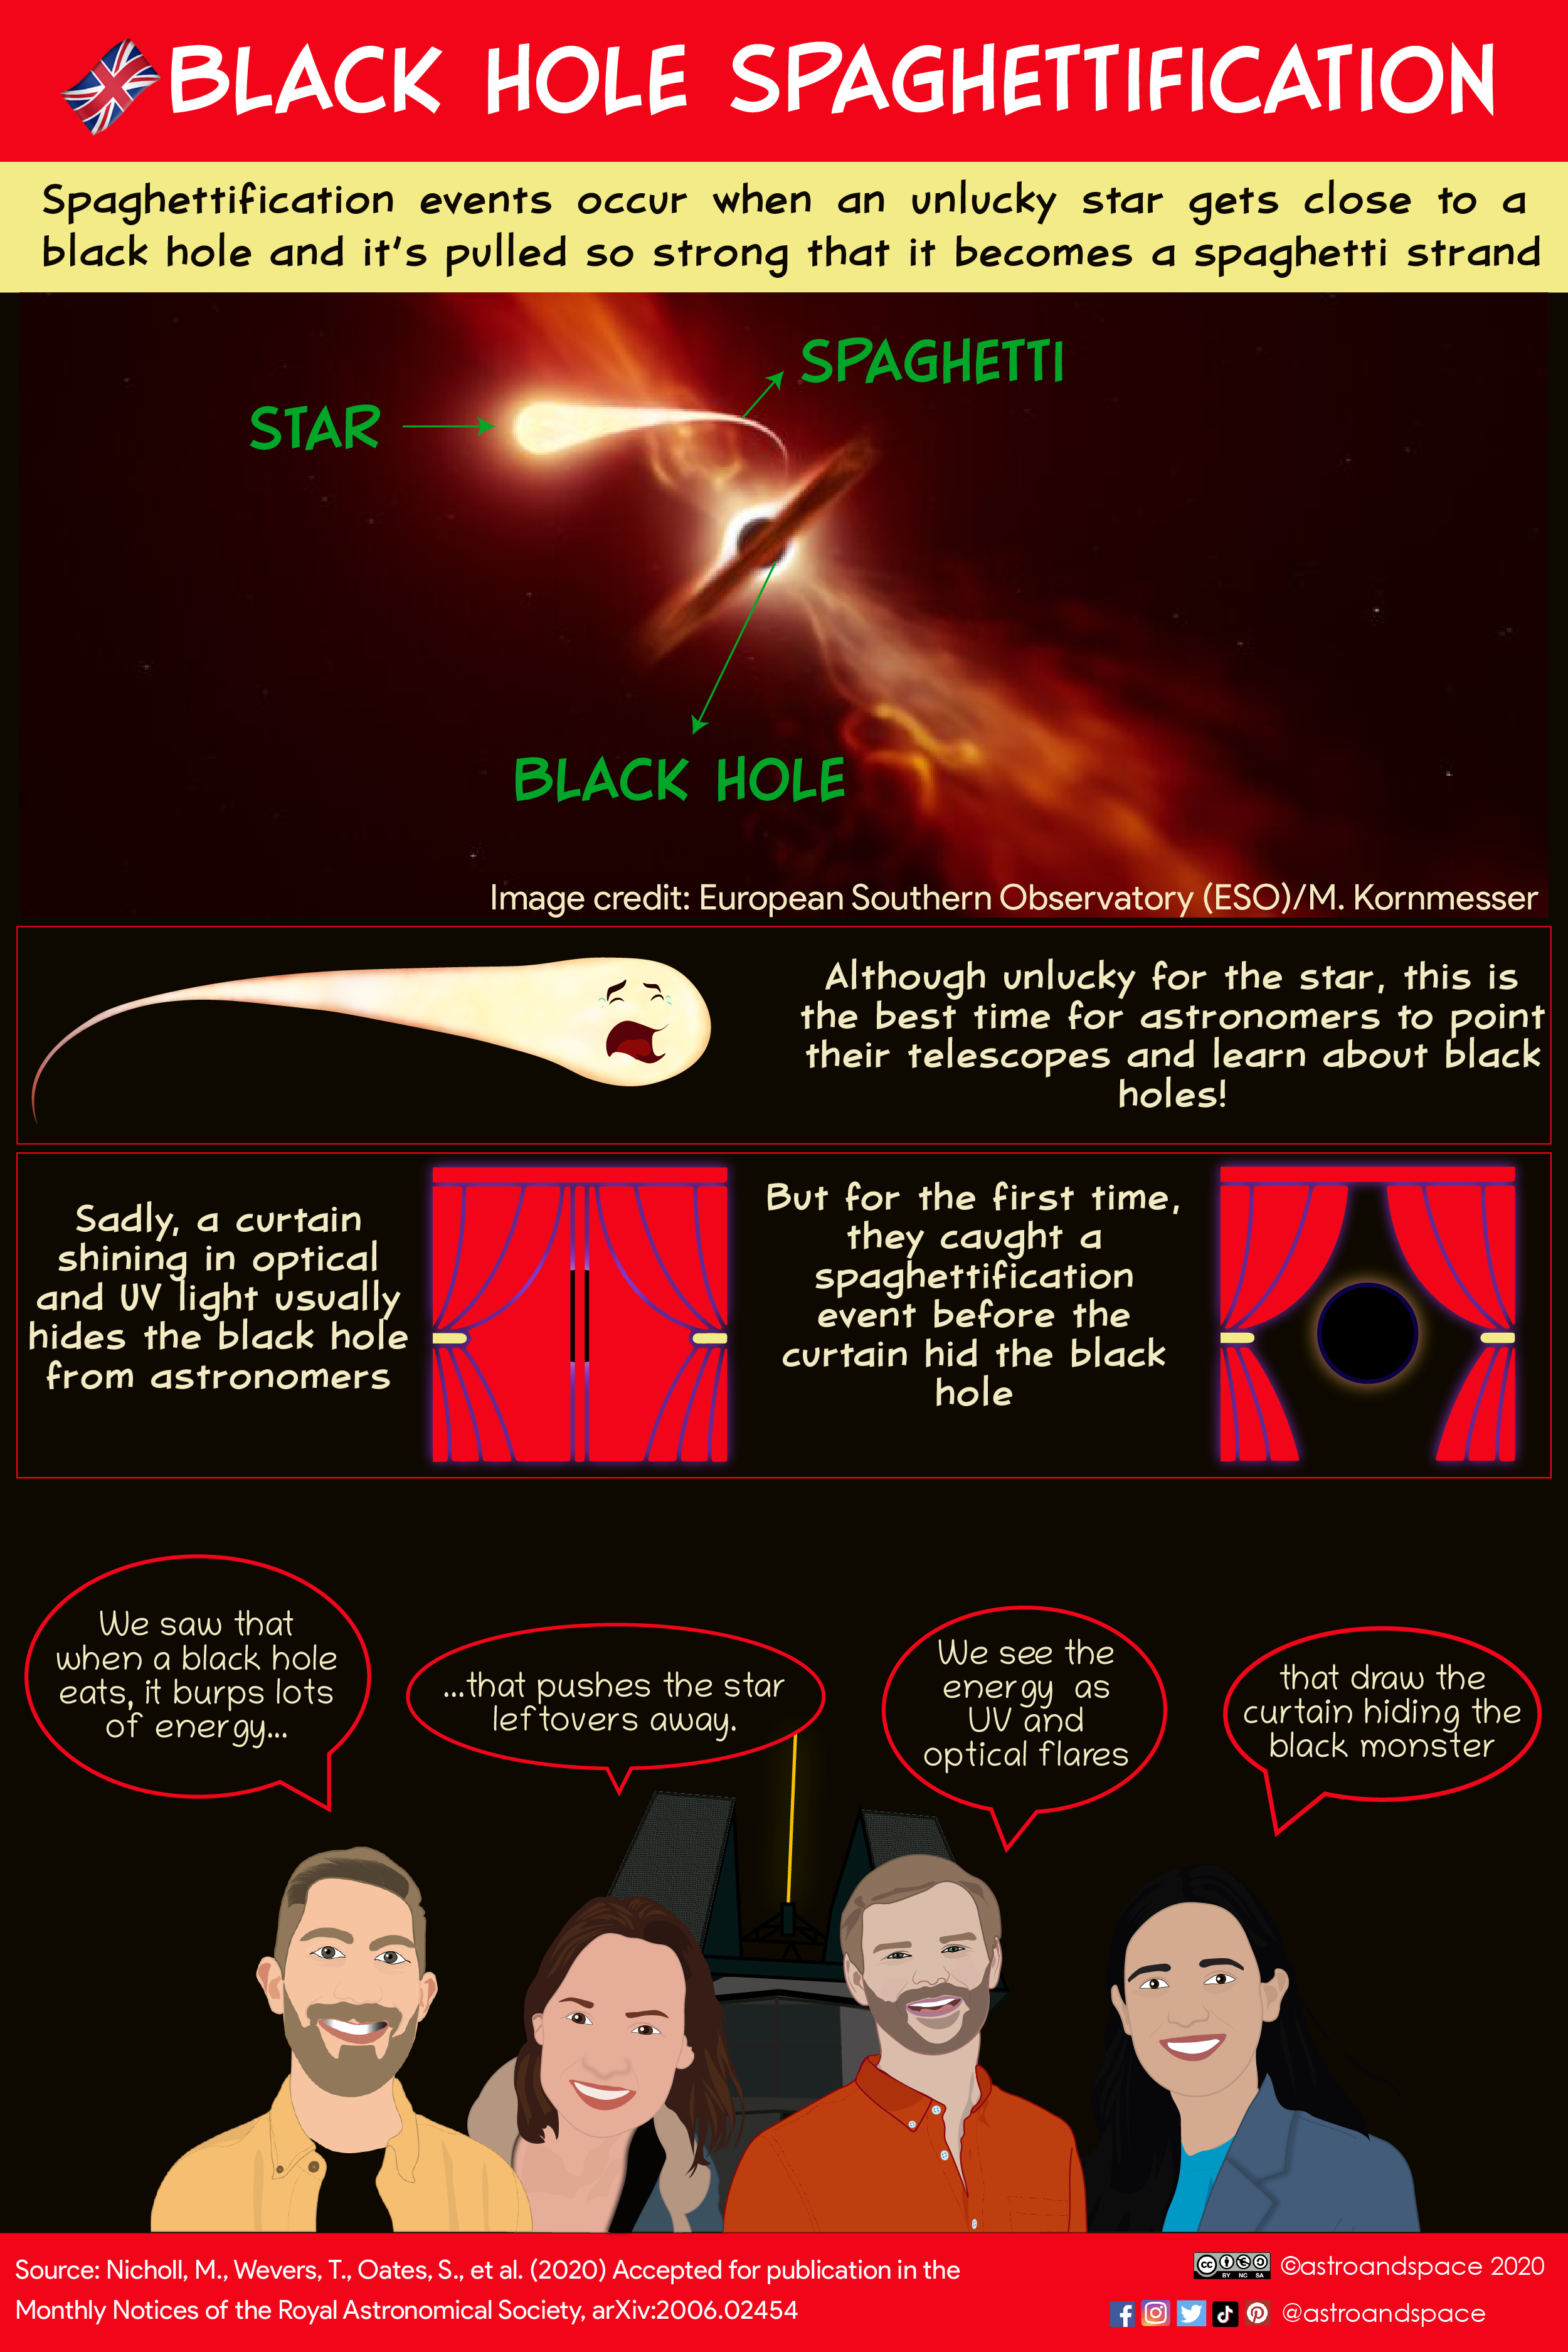
Infographics of Dr Matt Nicholl’s article: An outflow powers the optical rise of the nearby, fast-evolving tidal disruption event AT2019qiz
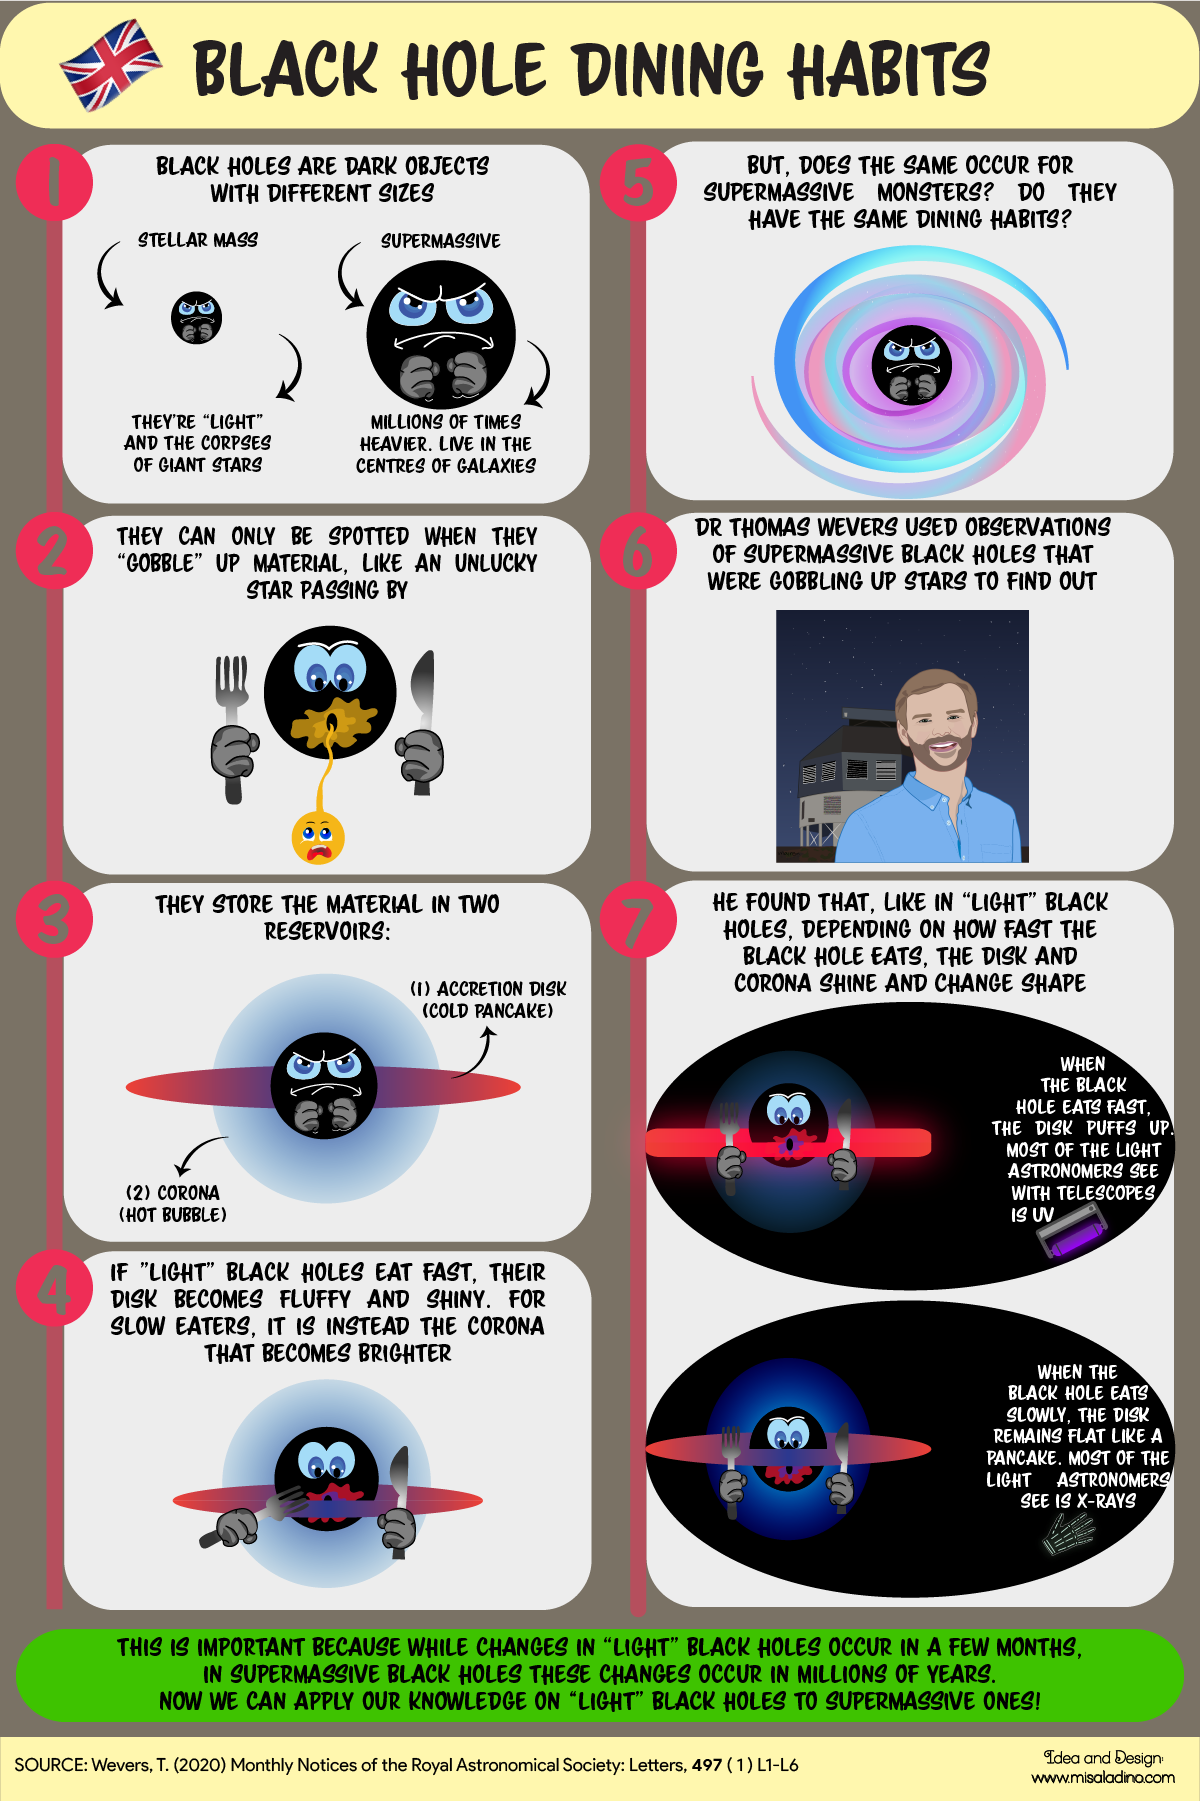
Infographics of Dr Thomas Wevers‘ article: Fainter harder brighter softer: a correlation between αox , X-ray spectral state and Eddington ratio in tidal disruption events
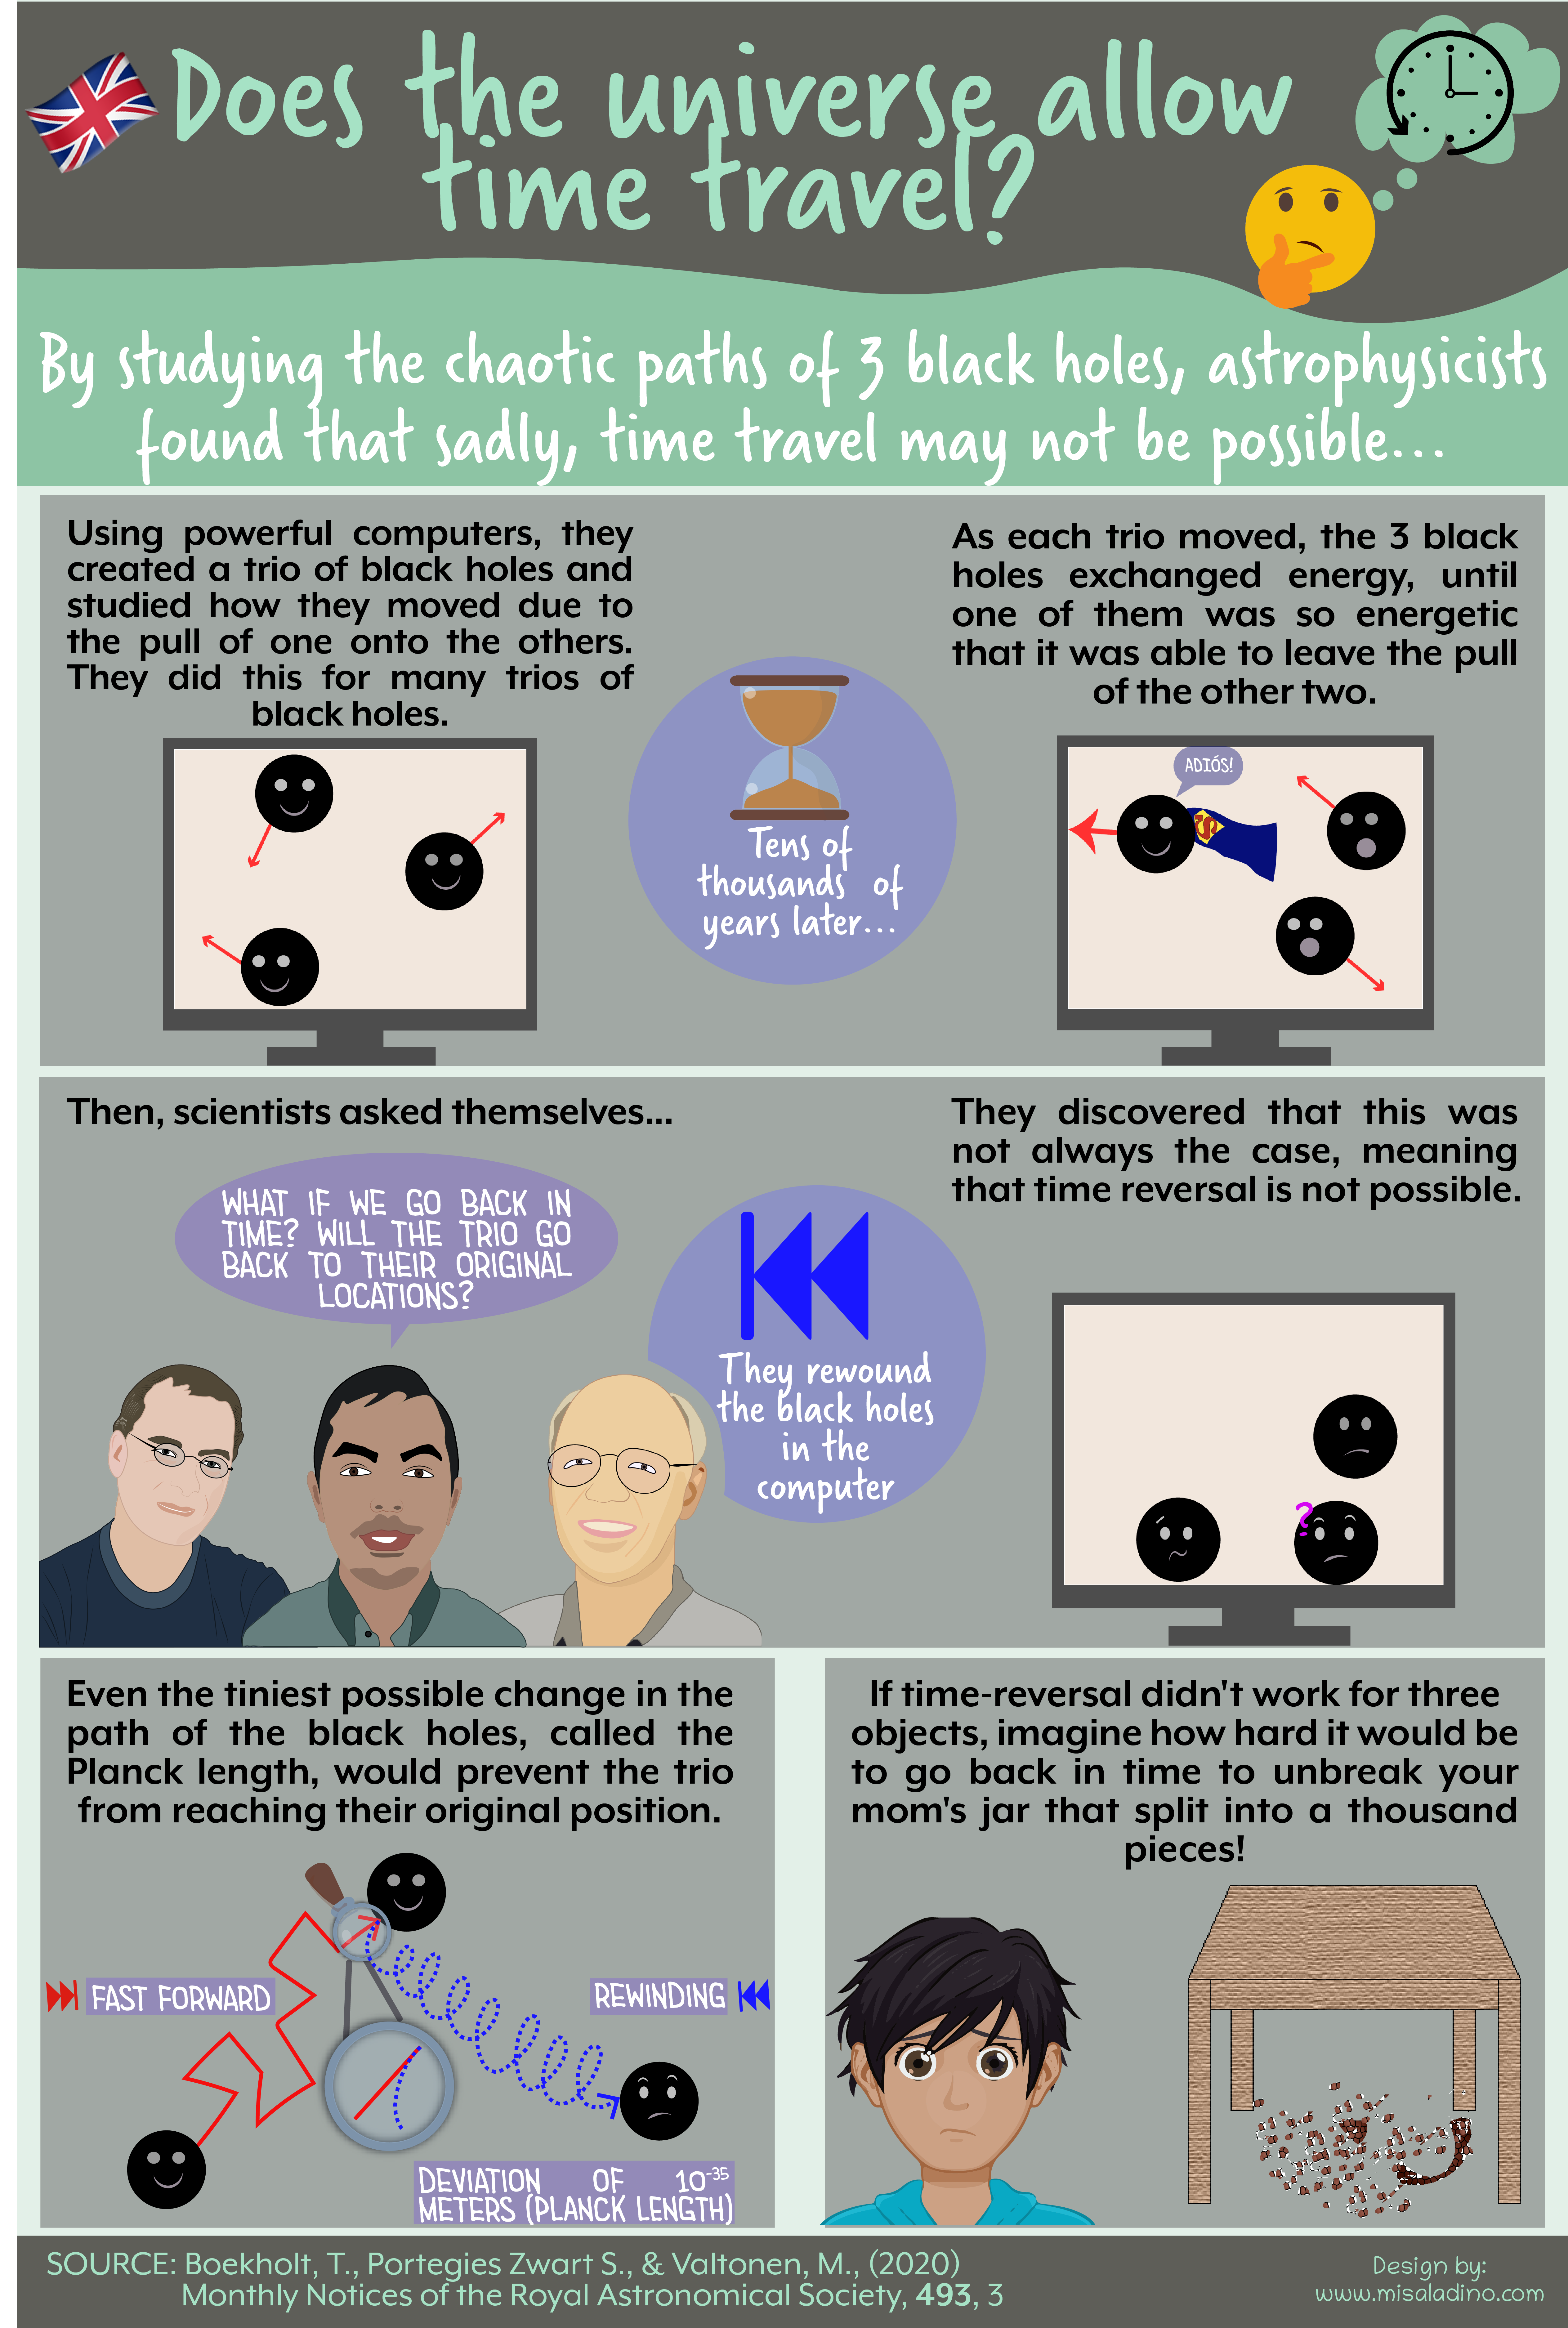
Infographics of Dr Tjarda Boekholt’s article: Gargantuan chaotic gravitational three-body systems and their irreversibility to the Planck length
#UnusualTopicsInAstronomy
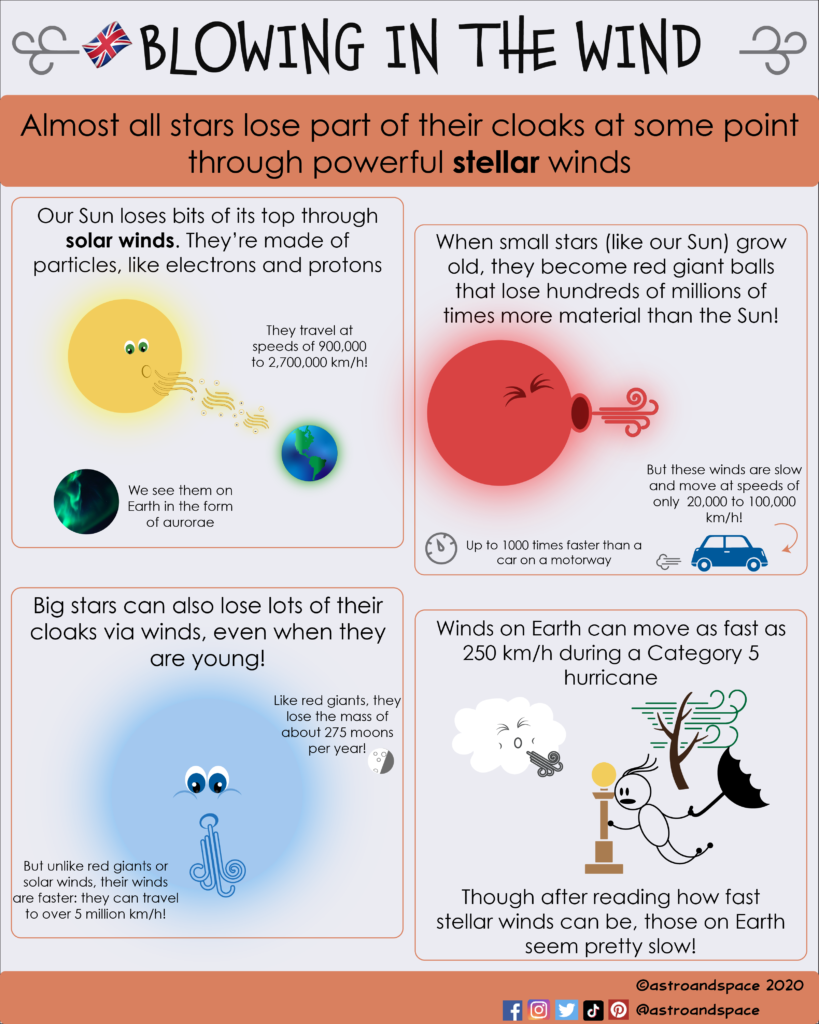
Stellar winds are flows of matter that remove part of the stars’ surface. Learn how fast they are, their types and how they compare to those on Earth
#Astronomers
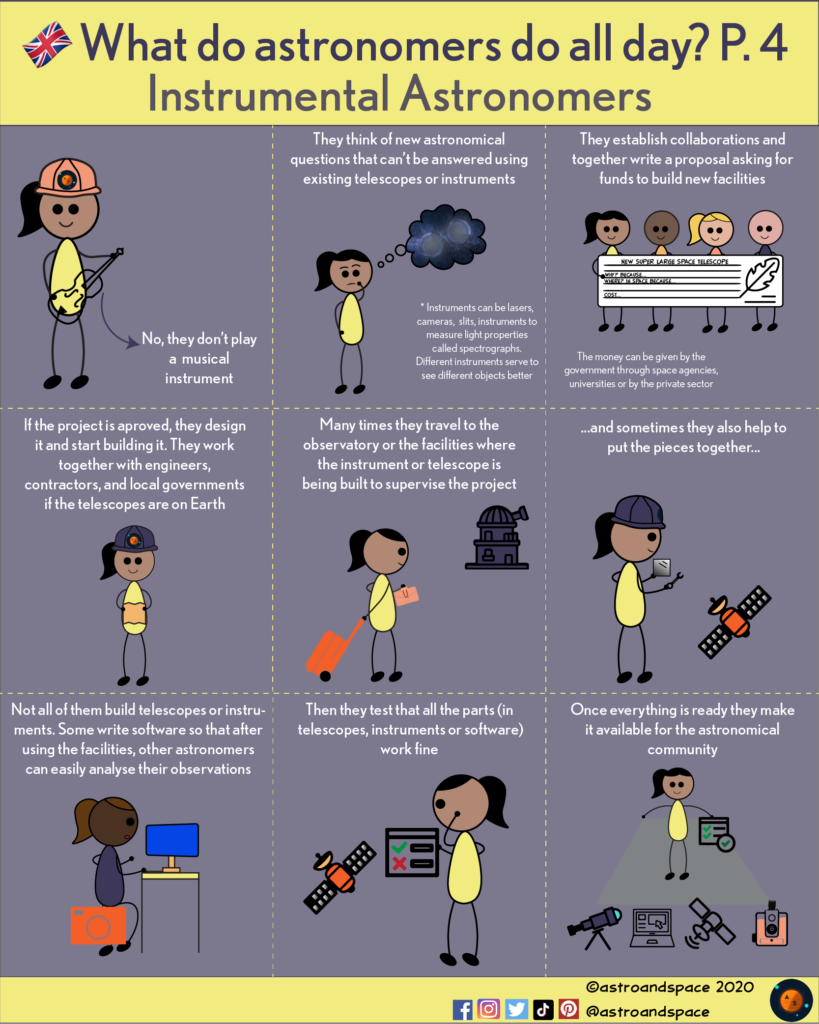
Last part of this series of infographics. Here I explain how instrumental astronomers work. They are the ones that are in charge of designing new telescopes!
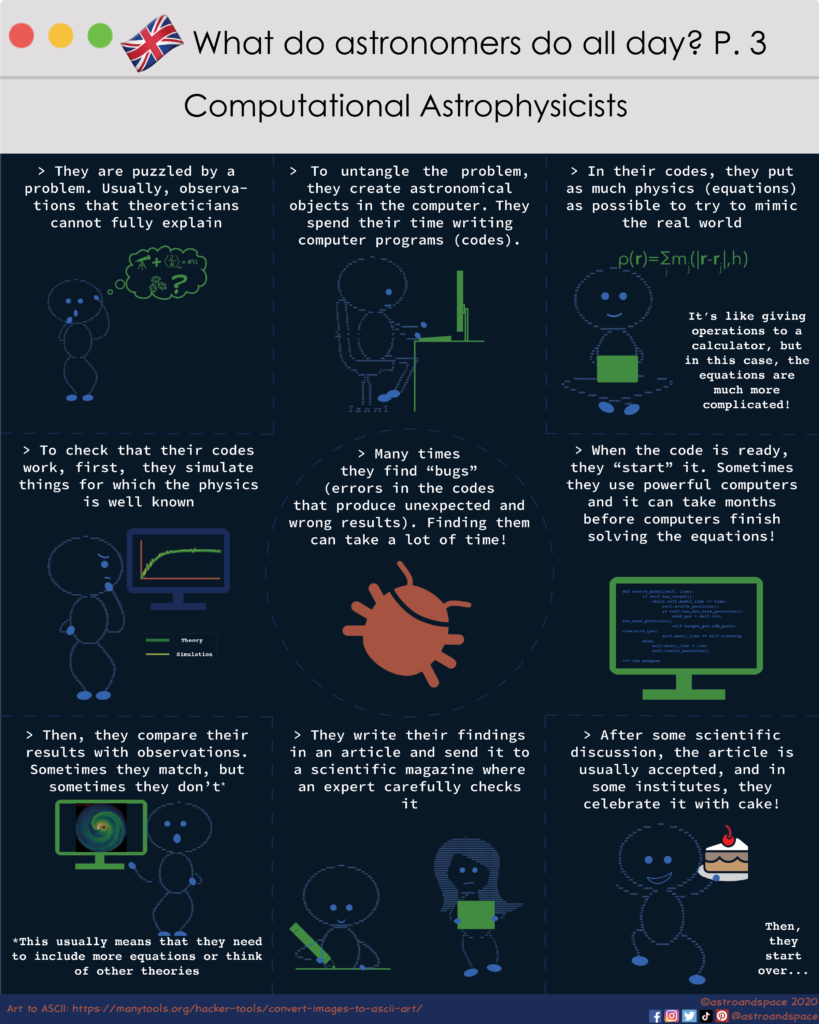
Not all astronomers look through a telescope to do their jobs. Find out how they do their research. In part 3 I talk about computational astrophysicists
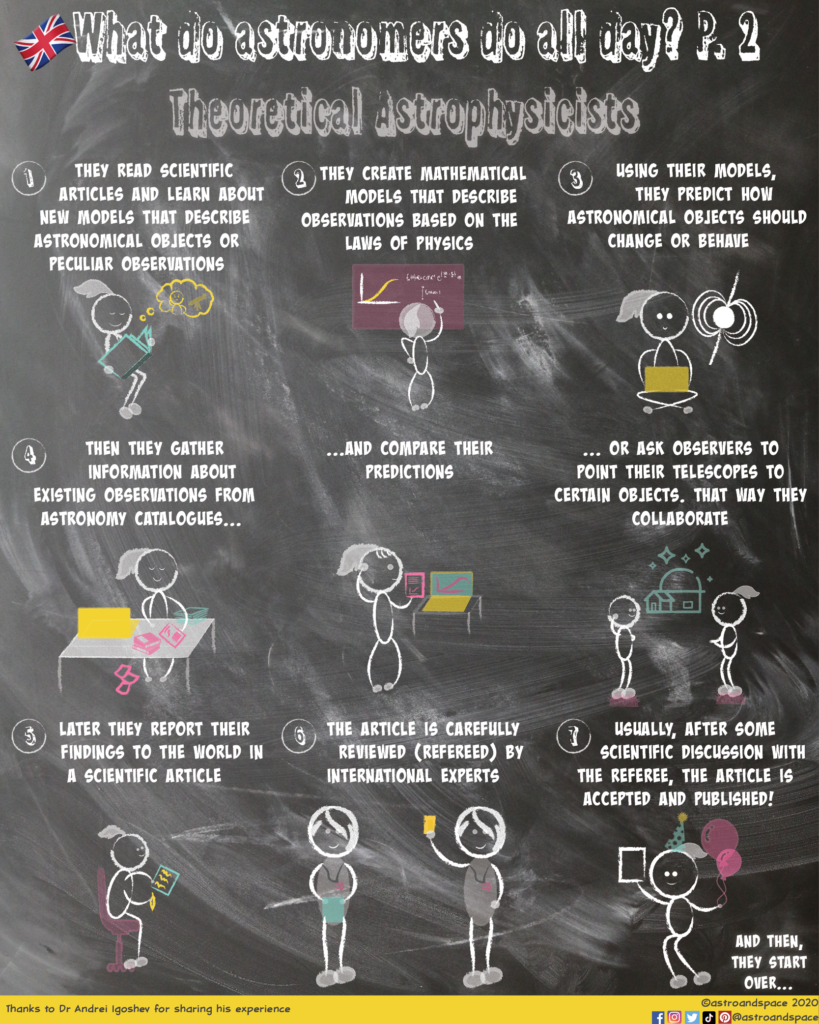
Not all astronomers look through a telescope to do their jobs. Find out how they do their research. In part 2 I talk about theoretical astrophysicists
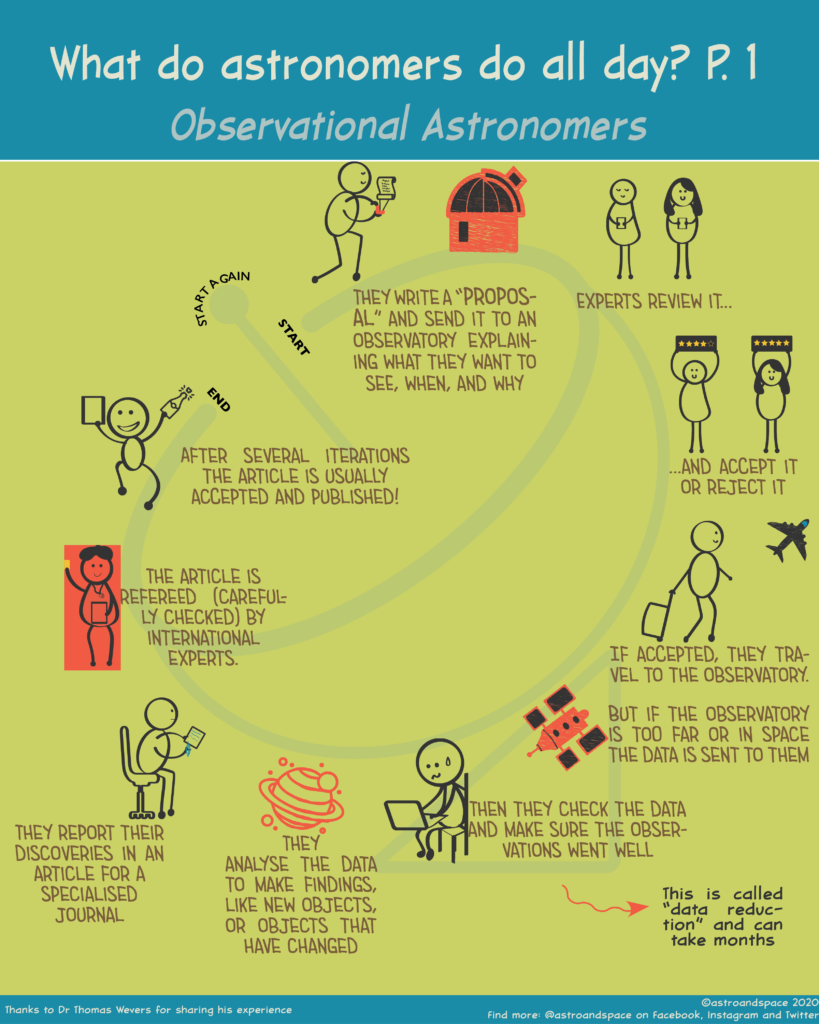
Have you ever wonder how astronomers do their job? Find out in these series of infographics! In this one, I talk about observational astronomers
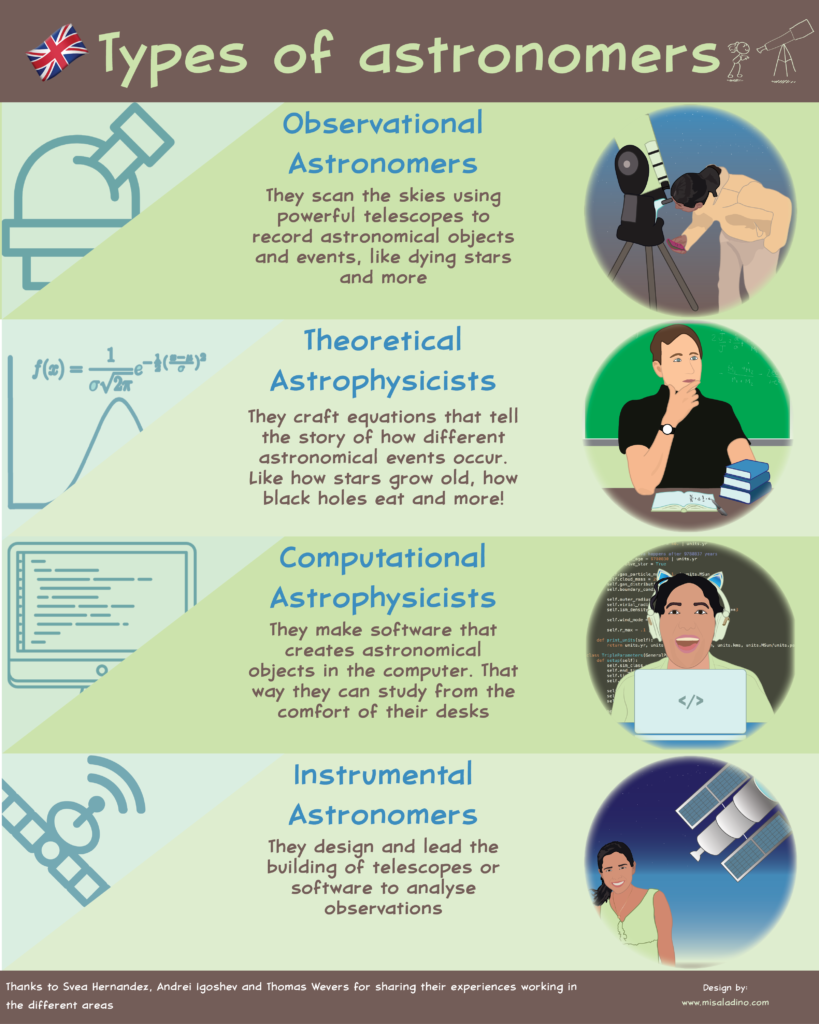
Infographics to explain the types of astronomers that exist.
